
Ultrasonic cavitation has emerged as a popular non-invasive alternative to traditional liposuction, offering a method to target stubborn localized fat without surgery, anesthesia, or extended downtime. However, amidst the marketing hype, it is crucial to separate realistic clinical outcomes from exaggerated claims. This guide explores the biological mechanisms behind ultrasound-driven fat disruption and collagen remodeling, explaining exactly how circumference reduction occurs. We will break down the expected timeline for visible results, from immediate tissue responses to peak metabolic clearance weeks later. Furthermore, we will examine the critical variables—including device specifications, treatment protocols, and individual lifestyle factors—that ultimately determine your success.

01What Is Ultrasonic Cavitation?
Ultrasonic cavitation is a non-invasive body contouring treatment that uses low-frequency sound waves — typically in the 30 kHz to 80 kHz range — to target localized fat deposits beneath the skin. Unlike surgical liposuction, there is no incision, no anesthesia, and no recovery downtime.
But the phrase "non-invasive" often creates a false impression. Cavitation is not a weight-loss procedure. It does not replace diet and exercise. And it certainly is not a one-and-done fix. The machines are designed to reduce circumference in specific areas — abdomen, thighs, flanks, arms — by disrupting fat cells mechanically, not by suctioning them out. A course of 6 to 12 sessions typically produces 2 to 5 cm of cumulative circumference reduction, not dramatic weight loss on a scale.
Three distinctions matter from the outset. First, cavitation is body contouring, not weight loss — the scale may barely move while the measuring tape shows real change. Second, the results are gradual, not instant — the body needs weeks to metabolize and eliminate the released fat. Third, cavitation does not prevent future fat gain — remaining fat cells can still expand if lifestyle habits slide. Keeping these in mind turns the rest of this article from abstract science into a practical decision-making tool.
02How Cavitation Produces Measurable Results
To understand what results are possible, you first need to understand the mechanism. Ultrasonic cavitation works through two distinct biological pathways — one immediate and mechanical, the other delayed and thermal. Both contribute to what a client ultimately sees in the mirror, but they operate on completely different timelines.
The Mechanical Pathway: Ultrasound-Driven Fat Cell Disruption
The primary mechanism is acoustic cavitation — the formation and violent collapse of microscopic bubbles within fat tissue.
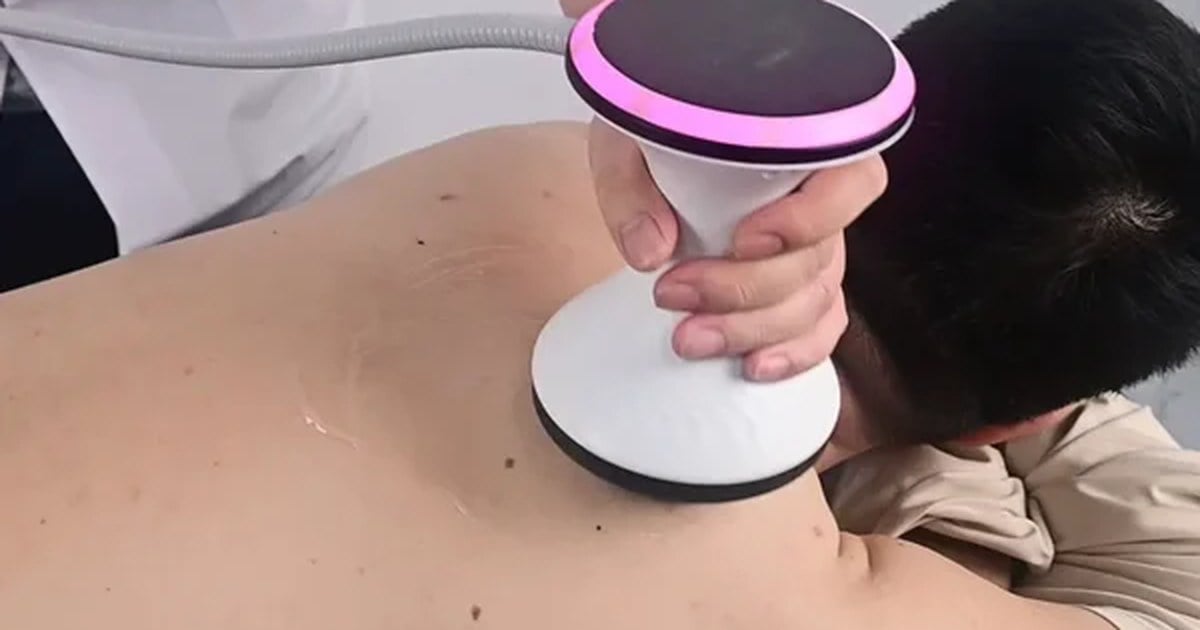
When an ultrasound transducer is placed against the skin with coupling gel, it emits pressure waves that propagate through the tissue. During the negative pressure phase of each wave cycle, the interstitial fluid between fat cells experiences a momentary drop in pressure — low enough to pull dissolved gases out of solution and form microbubbles. These bubbles, roughly 100 to 150 micrometers in diameter at resonance, grow with each successive acoustic cycle.
Once a bubble reaches its resonant size, the next pressure swing causes it to collapse violently — an implosion that releases a concentrated shockwave and microjet of fluid. Because adipose tissue has lower tensile strength than surrounding blood vessels, nerves, and connective tissue, the mechanical stress selectively ruptures adipocyte cell membranes. This process was documented in detail by Bani et al. (2013), whose histological analysis of human adipose tissue after low-frequency ultrasound treatment showed adipocyte size reductions of 23% to 47% in vivo — achieved without detectable damage to microvasculature, dermal fibroblasts, or epidermal keratinocytes (University of Florence, Department of Anatomy, 2013).
The triglycerides released through these membrane micropores enter the interstitial space, then drain through the lymphatic system into the bloodstream. The liver processes them over the following 72 hours — which is why hydration and light physical activity during this window significantly influence net results.
Collagen Remodeling and the Skin-Tightening Effect
The second pathway is less discussed but equally important for aesthetic outcomes. As ultrasound energy passes through tissue, a portion converts to heat — raising the temperature of the deep dermis to approximately 40 to 45°C. Sustained for several minutes, this thermal stimulus activates heat shock proteins and prompts dermal fibroblasts to upregulate collagen synthesis.
Unlike the mechanical effect — which begins immediately — collagen remodeling unfolds over months. New type I and type III collagen deposition typically peaks 4 to 8 weeks post-treatment, with visible skin tightening continuing to improve for 3 to 6 months after a full course. This is why the best before-and-after photos are often taken 8 to 12 weeks after the final session, not the day after.
The clinical implication is important: when cavitation is combined with radiofrequency (RF) — which delivers additional thermal energy to the dermis — the skin-tightening component is amplified. A 2019 interventional study of 129 participants found that combined RF and ultrasound cavitation produced significant reductions in abdomen, waist, and thigh circumference after 10 sessions, with results exceeding what either modality achieves alone (Modern Care Journal, 2019).
03Realistic Results: The Timeline and How to Measure Them
If there is one question that dominates the search for "cavitation results," it is this: "How many sessions until I see a difference?" The answer depends on understanding that cavitation results unfold in phases, not all at once.

Session by Session: What Changes and When
The results timeline breaks into four distinct stages:
After 1 session (immediate): Most people notice a 0.5 to 2 cm reduction in the treated area’s circumference. Some of this is genuine fat cell disruption; some reflects temporary fluid redistribution in the tissue. Either way, the immediate difference — while modest — provides an important psychological anchor: the treatment is doing something.
After 3 to 4 sessions (early cumulative): This is where the trend becomes visible. The body has now cleared the triglycerides from the first few treatments, and each new session builds on progressively fewer remaining fat cells in the target zone. Circumference reduction typically reaches the 1 to 3 cm range. At this stage, clients often report that clothes fit differently even if the mirror hasn’t caught up yet.
After 6 to 8 sessions (mid-course): By now, most clients see 2 to 4 cm of cumulative reduction. The skin-tightening effect from earlier sessions is beginning to manifest, improving the visual quality of the result beyond just the numbers on a measuring tape.
8 to 12 weeks after the final session (peak results): This is the window that matters most. The body has completed its full metabolic clearance of released fat, and collagen remodeling has reached its peak. Final circumference reduction in well-responders ranges from 2 to 5 cm for a full 8-to-12-session course. A 2021 randomized trial published in PLOS ONE confirmed that adding focused ultrasound cavitation to aerobic exercise produced significantly greater waist circumference reduction than exercise alone — reinforcing that cavitation is an amplifier, not a standalone solution (PLOS ONE, 2021).
What the Numbers Actually Mean
Circumference reduction is the most commonly cited metric, but it needs context. A 3 cm reduction at the waist looks different on someone starting at 90 cm versus someone starting at 70 cm. And the measuring tape captures only one dimension — it says nothing about skin texture, contour smoothness, or the visual impression that ultimately matters to a client.
Different body areas also respond differently. The abdomen — with its relatively uniform fat pad and good blood supply — typically shows the strongest response to 40 kHz ultrasound, which penetrates to a depth of 3 to 5 cm. The thighs, with denser fibrous septa interlacing the fat lobules, respond more slowly and may need higher session counts. The arms, with their thinner fat layer, often benefit more from 80 kHz ultrasound targeting the superficial 1 to 2 cm.
Ultrasound measurements tell a more precise story: single-session reductions in subcutaneous fat layer thickness typically range from 0.3 to 1.2 mm at the measurement level. These numbers sound small, but when multiplied across a treatment area of several hundred square centimeters and accumulated over 8 to 12 sessions, they translate into the centimeter-scale circumference changes that clients actually notice.
04Why Cavitation Results Vary: The Variables That Matter
This is the section most articles avoid. It is easier to show a dramatic before-and-after and imply that "results may vary" in fine print than to explain exactly which variables drive the variation. But if you are evaluating cavitation — whether as a potential client or as a clinic owner about to invest in equipment — understanding this framework is the difference between informed decisions and costly guesses.
Cavitation results sit at the intersection of three variable categories: the device, the protocol, and the individual. Weakness in any one of them drags down the outcome.
Device Parameters: Frequency, Power, and Probe Quality
Frequency and penetration depth: 40 kHz ultrasound penetrates to roughly 3 to 5 cm, making it appropriate for abdominal and thigh fat. 80 kHz ultrasound reaches only 1 to 2 cm, limiting it to superficial applications like the arms or chin. A machine offering only one frequency cannot optimally treat all body areas. The best professional platforms offer both, letting the operator match the frequency to the anatomy.
Power density and the cavitation threshold: Cavitation bubbles do not form unless the acoustic pressure at the probe surface exceeds a minimum threshold — approximately 0.5 to 1.0 MPa peak negative pressure. This translates to a power density of around 0.5 to 3 W/cm2 at the transducer face, depending on frequency and tissue impedance. Devices that cannot sustain this output — or that drift significantly from their rated power over the course of a treatment session — produce inconsistent or absent cavitation effects. Medical-grade equipment typically maintains output fluctuation within ±10%. Lower-tier devices can drift by ±20 to 30%, meaning some session minutes generate no meaningful cavitation at all.
Probe quality and acoustic field uniformity: The probe is where electrical energy becomes therapeutic ultrasound. Stainless steel or titanium alloy probes with a well-characterized effective radiation area (ERA, typically 3 to 7 cm2) deliver a uniform acoustic field across the treatment surface. Poorly manufactured probes create hot spots and dead zones — some tissue receives excessive energy while adjacent areas receive almost none. Over a full treatment course, this inconsistency compounding into unpredictable results.
These manufacturing variables are not theoretical — they reflect the quality control infrastructure behind the equipment. Devices built under ISO 13485 certification, the international quality management standard for medical devices, are produced within a framework that mandates output calibration, traceable acoustic power measurement, and batch-level consistency testing. Manufacturers with this certification — along with CE, FDA, and RoHS compliance — back their specifications with documented verification, not marketing claims. Konmison, a Guangzhou-based beauty equipment manufacturer, operates under ISO 13485 and maintains a full international compliance stack that includes CE, FDA, RoHS, FCC, and MSDS certifications. Its manufacturing process incorporates 303 stainless steel probe components, 48-hour PCB aging tests, and 100% incoming parts inspection — practices that directly reduce the unit-to-unit output variability that undermines clinical consistency (ISO 13485-certified manufacturing facility). When evaluating any cavitation device, the question to ask is not "what power does the spec sheet claim" but "what quality system ensures every unit actually delivers it" (professional-grade cavitation equipment).
Treatment Protocol: Frequency, Duration, and Technique
Session frequency and the metabolic clearance window: The body needs approximately 72 hours to clear triglycerides released by a single cavitation session. Scheduling treatments closer together than this does not accelerate results — it simply overwhelms the lymphatic system’s clearance capacity, leading to temporary fluid retention and a misleading plateau in measurements. The standard protocol of 2 sessions per week, spaced 3 to 4 days apart, exists for a physiological reason, not an arbitrary one.
Per-area treatment duration: Clinical studies typically apply ultrasound for 15 to 20 minutes per area for the abdomen, 10 to 15 minutes for the arms, and 20 to 30 minutes for the thighs. Shorter durations may not generate enough cumulative cavitation events to disrupt a meaningful proportion of adipocytes in the treatment zone. But longer is not always better — exceeding 30 minutes on a single area increases the risk of localized discomfort without proportional additional benefit.
Probe movement technique: The transducer should move continuously in slow, overlapping circles — never held stationary. A stationary probe creates a standing wave pattern that concentrates energy at fixed tissue depths, potentially causing thermal discomfort. Continuous movement ensures the acoustic field is distributed evenly across the treatment area. Inadequate coupling gel is a surprisingly common protocol failure — insufficient gel coverage can reflect 30 to 50% of the acoustic energy back to the transducer rather than transmitting it into the tissue.
Individual Factors: Biology, Hydration, and Lifestyle
Metabolic rate and fat clearance efficiency: Once triglycerides are released from adipocytes, they must travel through the lymphatic system to the bloodstream and then to the liver for metabolism. A person with a higher resting metabolic rate clears this lipid load faster, meaning each session’s effect is fully realized before the next one builds on it. Someone with slower metabolism may still be processing session 3’s lipids when session 5 is already scheduled — creating a backlog that blunts the apparent rate of progress.
Hydration status and lymphatic flow: The lymphatic system is the body’s lipid transport infrastructure, and it runs on water. At rest, lymphatic flow is approximately 2 to 3 liters per day. With adequate hydration and light activity, this can increase to 5 to 10 liters per day. A dehydrated client — or one who skips the recommended 2 to 3 liters of daily water intake — is running a lipid clearance system at half capacity. The fat is released, but it lingers in the interstitial space, delaying measurable circumference reduction.
Post-treatment behaviors — the make-or-break 72 hours: The 72 hours following each session represent a critical metabolic window. Light exercise within 4 to 6 hours of treatment — a brisk walk or gentle stretching — increases fatty acid oxidation and lymphatic pumping. Alcohol consumption during this window is particularly counterproductive: a single episode of significant drinking (more than 30 grams of ethanol, roughly 2 standard drinks) can reduce hepatic fatty acid oxidation by 30 to 50% for 12 to 24 hours, as the liver prioritizes alcohol metabolism over lipid clearance. A surge of refined carbohydrates elevates insulin, which signals fat cells to store rather than release — working directly against what the cavitation treatment just accomplished.
05Getting the Best Possible Cavitation Results
If the previous sections establish the "why" behind result variability, this section distills it into the "what to do about it." Cavitation results are not random. They follow a predictable equation: Device Quality × Protocol Adherence × Individual Compliance = Net Outcome. Weakness in any multiplier reduces the product.

Here is what that means in practice:
- Choose equipment with verifiable specifications. Ask for documented power output calibration, not just a spec sheet. ISO 13485 certification means the manufacturer has a quality system that makes those specifications auditable — not just marketing promises. A device that cannot prove its output consistency cannot prove it will produce consistent results.
- Follow the 72-hour rule. Space sessions at least 3 days apart. Scheduling treatments on consecutive days does not accelerate progress — it congests the metabolic clearance pathway and flattens the results curve.
- Hydrate aggressively. Two to three liters of water daily, every day of the treatment course — not just on treatment days. The lymphatic system moves lipids; water moves the lymphatic system. Without adequate hydration, released fat sits in the tissue rather than being cleared.
- Move within 4 to 6 hours after each session. A 20-to-30-minute walk or equivalent light activity increases both fatty acid oxidation and lymphatic flow rate during the peak lipid-release window. This single behavior amplifies every session’s net effect.
- Avoid alcohol for 48 hours and refined carbohydrates for 72 hours post-treatment. These are not lifestyle suggestions — they are metabolic prerequisites. Alcohol competes for the liver’s processing capacity at the exact moment it is needed for lipid clearance. Refined carbohydrates trigger insulin release that counteracts fat mobilization.
- Wait 8 to 12 weeks after the final session before judging final results. The body’s collagen remodeling and metabolic clearance operate on their own timeline, not the calendar. Measuring too early undercounts the true outcome.
The single biggest predictor of cavitation results is not the machine, not the clinic, not even the individual’s starting measurements. It is whether all three multipliers in the equation are simultaneously optimized. The best device with poor protocol adherence produces mediocre results. The best protocol with a dehydrated client produces mediocre results. Excellence in one category cannot compensate for neglect in another.
If you are comparing equipment options and want to evaluate specifications beyond what is covered here, Konmison’s product catalog provides detailed technical documentation for professional cavitation platforms. (Konmison)
References
- Bani D, Quattrini Li A, Camilli M, et al. Histological and Ultrastructural Effects of Ultrasound-induced Cavitation on Human Skin Adipose Tissue. Plastic and Reconstructive Surgery — Global Open. 2013;1(6):e41. https://pmc.ncbi.nlm.nih.gov/articles/PMC4174158/
- Combined Radiofrequency and Ultrasound Cavitation for Anthropometric Indices: A Four-Group Interventional Study. Modern Care Journal. 2019. https://sciprofiles.com/publication/view/1daddbd94be0ed7f2b8621465025c242
- Focused Ultrasound Cavitation Combined with Aerobic Exercise for Abdominal Fat Reduction. PLOS ONE. 2021;16(4):e0250116. https://journals.plos.org/plosone/article?id=10.1371/journal.pone.0250116
- Pugliese D, Palumbo P, Coronella L, et al. Histopathological Features of Tissue Alterations Induced by Low Frequency Ultrasound with Cavitational Effects on Human Adipose Tissue. International Journal of Immunopathology and Pharmacology. 2013;26(2):541-547. https://pubmed.ncbi.nlm.nih.gov/23755772/
- Konmison Quality Assurance — ISO 13485 Certification and Compliance Documentation. https://www.konmison.com/quality/
- Konmison Professional Cavitation Machine — Product Specifications. https://www.konmison.com/cavitation-machine/
- Konmison — Custom Beauty Machine Manufacturer. https://www.konmison.com/


 EN
EN  RU
RU  ES
ES  IT
IT  AR
AR  FR
FR  DE
DE  JA
JA  KO
KO  NL
NL